Skip to content

New guideModernizing a legacy system without stopping the business

09 — Data & Analytics

Reporting you can trust, from data you already have.

Most reporting problems are data problems: the same number calculated three ways, reports assembled by hand, dashboards nobody trusts. We build the pipelines, models and dashboards that turn operational data into consistent reporting — and fix the source systems when that's where the problem really is.

Capabilities

What this service covers.

  1. 01

    Operational dashboards

    Role-specific dashboards embedded in the systems people already use.

  2. 02

    Reporting models

    Agreed definitions for key figures, implemented once.

  3. 03

    Data pipelines

    Scheduled extraction and transformation from operational systems.

  4. 04

    Warehousing

    A reporting database separate from production workloads.

  5. 05

    Exports and scheduled reports

    CSV, PDF and email reports on a schedule.

  6. 06

    Data quality

    Validation and reconciliation checks that flag inconsistencies.

What We Build

Data & Analytics solutions we deliver.

One reliable source for the numbers your team decides on.

Example Data & Analytics interface built by Eryon
  • 01

    BI dashboards

    Business intelligence dashboards built on agreed metric definitions.

  • 02

    Executive reporting

    A single view of sales, operations and finance for leadership.

  • 03

    Real-time operational dashboards

    Live status for teams who act on data during the day.

  • 04

    Data pipelines (ETL)

    Scheduled extraction and transformation from your systems.

  • 05

    Data warehousing

    A reporting database separate from production workloads.

  • 06

    Report automation

    PDF, Excel and email reports delivered on schedule.

  • 07

    Embedded analytics

    Charts and reports inside your own product or portal.

  • 08

    Data quality checks

    Validation that flags missing or inconsistent records.

Use Cases

When clients bring us in.

Monday-morning spreadsheets

Reports rebuilt by hand every week.

Numbers that don't agree

Different teams reporting different figures.

Reporting slowing production

Heavy queries running against the live database.

No view across branches

Each location reports separately.

Where It's Used

Problems we solve, sector by sector.

  • Retail and e-commerce

    The problem
    Sales, stock and marketing data don't line up.
    What we build
    Unified sales and inventory dashboards by product, channel and region.
  • Manufacturing

    The problem
    Production and dispatch figures come from different sheets.
    What we build
    Operational dashboards connected to stock, orders and dispatch.
  • Education

    The problem
    Academic and fee data sit in separate modules.
    What we build
    Campus dashboards combining attendance, results and fee collection.
  • SaaS companies

    The problem
    Nobody agrees on active users or churn.
    What we build
    Product and revenue metrics defined once and reported consistently.
  • Financial services

    The problem
    Management packs are assembled manually each month.
    What we build
    Automated monthly reporting with reconciliation checks.
  • Multi-branch businesses

    The problem
    Each branch reports in its own format.
    What we build
    Standardised branch reporting with head-office roll-ups.

Recognise your situation here?

Talk to an engineer

How We Deliver

Delivery you can plan around.

Metric definitions first

Each key figure defined and agreed before a chart is built.

Source fixes

Data problems fixed at the source where possible.

Reconciliation

New reports checked against known figures before rollout.

Documentation

A data dictionary your team can maintain.

Deliverables

  • Metric definitions and data dictionary
  • Pipelines and reporting database
  • Dashboards and scheduled reports
  • Data quality checks
  • Handover documentation

Technology Stack

Tools we use for this work.

  • PostgreSQL
  • Python
  • SQL
  • MongoDB
  • Redis
  • Node.js
  • React
  • Google Sheets API
  • Docker

Security & Scalability

  • Separated workloads

    Reporting runs on replicas or a warehouse, not on production.

  • Incremental loads

    Pipelines process changes rather than full reloads.

  • Access control

    Sensitive figures restricted by role.

  • Lineage

    Every figure traceable to its source.

Process

From first workshop to production.

  1. 01 · Discover

    Workshops with the people who run the process today. We map how work actually moves, where it stalls and what the system must never get wrong.

  2. 02 · Define

    A written scope: users and roles, core workflows, integrations, non-functional requirements and a release plan you can hold us to.

  3. 03 · Architect

    Data model, service boundaries, hosting, security model and the trade-offs behind each choice — reviewed with your team before code starts.

  4. 04 · Build

    Short sprints with a working demo every week. Code review on every change, automated tests on the paths that carry money or data.

  5. 05 · Validate

    Functional QA, role-by-role acceptance, performance checks and a security pass before anything reaches production users.

  6. 06 · Scale

    Staged rollout, monitoring and a support window. Then the backlog of improvements that only real usage reveals.

Related Case Studies

Where we've done this before.

Manufacturing & Distribution · Web

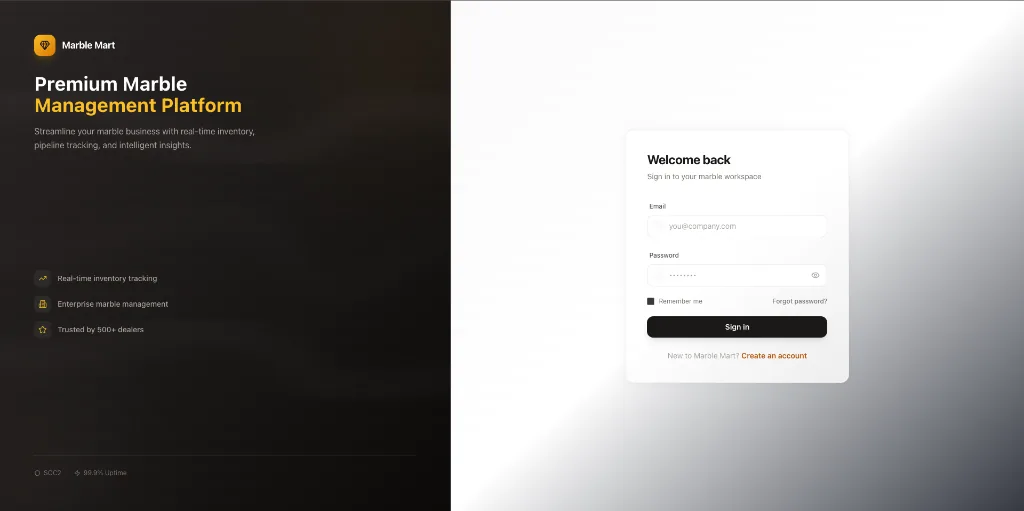
MarbleMart CRM

Sales and inventory CRM for a stone distributor

Challenge
High-value marble inventory across warehouses was tracked in spreadsheets, so sales rarely knew what was actually available.
Solution
A role-based CRM where logistics updates stock and the sales team sees it immediately, with quotations and invoices generated from the same records.
Outcome
One live view of stock, leads and quotations shared by sales, logistics and management.
Technology
  • Next.js
  • TypeScript
  • PostgreSQL
  • Supabase
  • Tailwind CSS
Read the case study

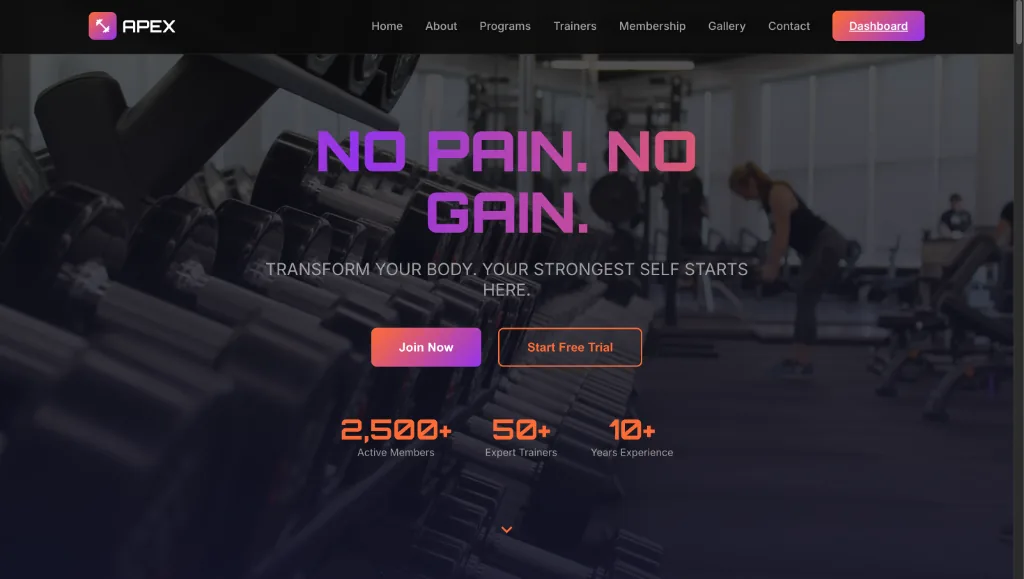
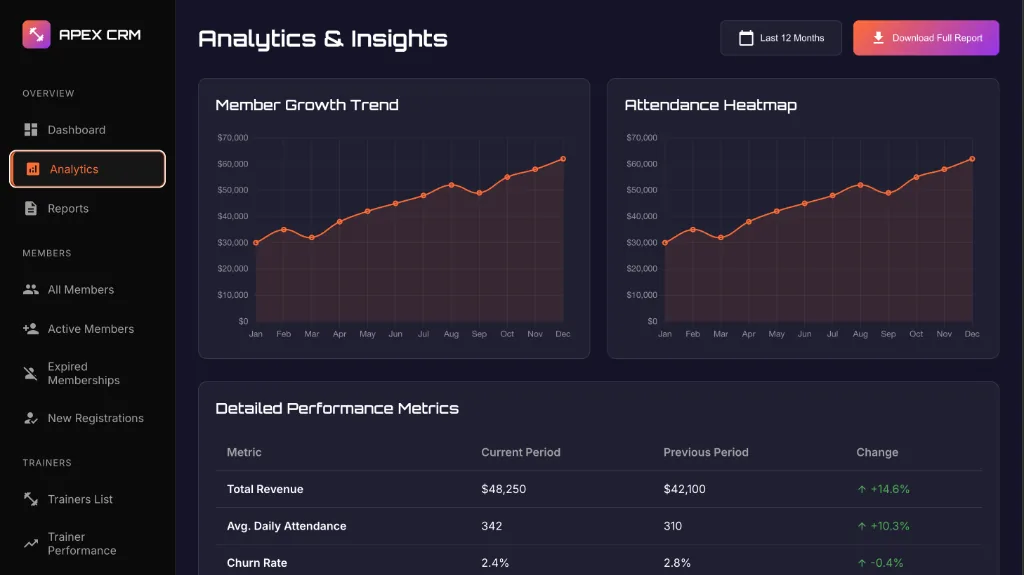
Fitness & Wellness · Web

Gym Operations Dashboard

Membership, billing and check-in platform

Challenge
Fitness centres were reconciling payments and attendance by hand in desktop-bound software.
Solution
A cloud admin panel with recurring billing through Stripe and real-time check-in sync.
Outcome
Memberships, recurring billing and check-ins in one cloud dashboard usable from a tablet on the gym floor.
Technology
  • Next.js
  • React
  • Supabase
  • PostgreSQL
  • Stripe
  • Tailwind CSS
Read the case study

Education · Web + Mobile

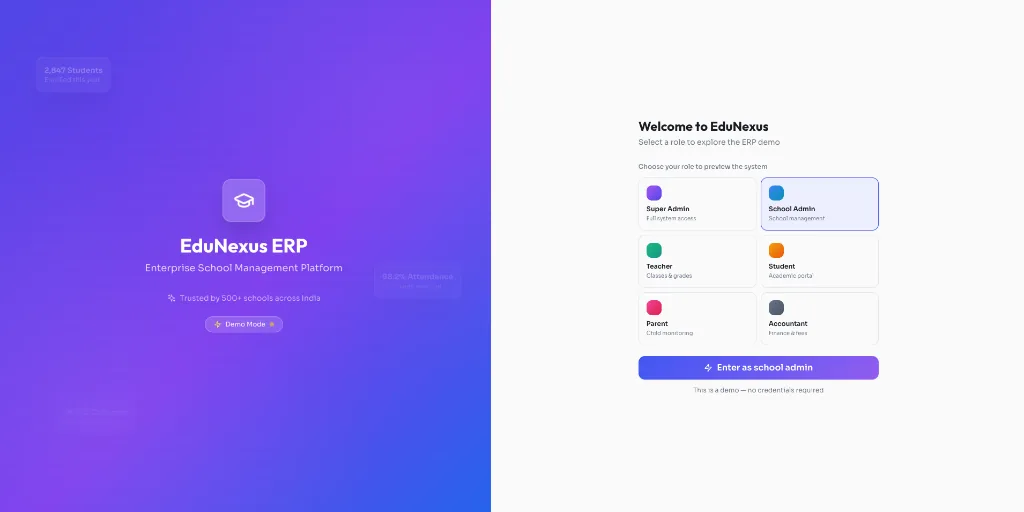
EduNexus

School ERP with web and mobile apps

Challenge
Schools were running admissions, attendance, fees and communication on separate systems that did not share data.
Solution
A multi-campus school ERP with role-based dashboards and mobile apps for parents, teachers and administrators.
Outcome
Admissions, academics, fees, transport and parent communication in one platform with dedicated mobile apps.
Technology
  • React
  • React Native
  • Java
  • Spring Boot
  • PostgreSQL
  • Twilio
Read the case study

FAQs

Common questions.

Do we need a data warehouse?

Not always. Many businesses start with a read replica and well-designed reports. A warehouse makes sense when data comes from several systems or volumes grow.

Can you work with data in spreadsheets?

Yes. We often begin by importing spreadsheet data and then move collection into proper systems.

Which dashboard tools do you use?

We build dashboards into your applications with React, or connect established BI tools, depending on who uses them.

How do you keep numbers consistent?

By defining each metric once in the data model and building every report on that definition.

What are data analytics services?

They cover collecting data from your systems, cleaning and modelling it, and presenting it as dashboards and reports people can act on.

Power BI, Metabase or custom dashboards?

BI tools suit internal analysts exploring data. Custom dashboards suit fixed operational views inside your own applications or for customers. We recommend based on who will use them.

Can you combine data from Excel, Tally and our CRM?

Yes. Pipelines can pull from spreadsheets, accounting exports and application databases into one reporting model.

How fresh will the data be?

From near real time to daily refreshes, depending on the source systems and what decisions the data supports.

Planning a project
like this?

Tell us what the system needs to do. We'll reply within 24 hours with questions, not a sales script.